First, as not all data is automatically considered to be Large type data, let’s define what “Large Data” is and what makes it “big” before moving on to a more in-depth examination of Large Data analytics.
The term “Big Data” describes large quantities of data of any form, including but not limited to the three forms : structured, unstructured, and semi-structured. Such data sets are constantly being produced at a high rate and in a considerable quantity. Although organizations increasingly rely on this data to inform and improve their decision-making, traditional data storage and processing infrastructures can’t keep up with the volume and variety of information being collected.
Vital factors in Big Data analysis
The four V’s are a set of Big Data properties essential to understanding it.

Volume
The sheer quantity of information is what “big data” alludes to. The Internet of Things (IoT), social media, text files, business transactions, and other activities generate daily terabytes to petabytes of data. Watching a single Netflix HD movie takes up more than 4 GB of space on your hard drive.
Consider for a second that a single petabyte can store 250,000 movies. Big Data, however, does not refer to a single petabyte but to many millions of bytes.
Velocity
It is the rate at which new information is created and processed. It can be described in a few different ways: in batches, in real-time or real-time processing, or roaming data.
The situation is ideal when the data production rate is equal to the data processing rate. Use the transportation industry as an illustration. A single internet-connected car with a telematics device plugged in generates and transmits 25 gigabytes of data every hour at an essentially constant rate. The bulk of this information also needs to be processed in near-real time.
Variety
A vector called “variety” represents the wide range of information that may be found in big data.
There is more to this information than what can be found in rows and columns of a relational database. Even though most large data is unstructured, it can take various forms depending on the context in which it will be used.
For instance, a simple social media post may include text, links to media files, a timestamp, etc.
Veracity
Data’s veracity, or the extent to which it is truthful, accurate, and reliable, and to what extent it adds value, is referred to as its credibility.
It’s possible that the analytics process won’t be as precise as it could be because of problems with the input data quality, consistency, or completeness.
This is why it’s common to practice to rate data as either good, bad, or undefined in terms of reliability. Knowing the fundamental criteria, you may understand that not all data can be referred to as Big Data, which is especially helpful when working with diverse data sets like medical records, where any differences or ambiguities may have disastrous effects.
Big data analytics have evolved over time.
The concept of “big data” has been around for some time. Most organizations now understand that by recording all of the data that goes into their companies (perhaps in real-time), they can apply analytics to it, derive significant value, and even more so when applying sophisticated techniques like AI.
While “big data” wasn’t coined until the 2010s, organizations have been using analytics to find insights and trends as early as the 1950s.

Its speed and efficiency in data analysis make it an effective tool. Once upon a time, businesses would gather data, run it through analytics, and look for insights they could use in future decision-making.
Since businesses can now collect data in real time and run big data studies, they can make more educated decisions immediately. Working faster without losing flexibility gives businesses an edge in the marketplace.
What is the process for analysing massive amounts of data?
Big data analytics transforms large amounts of raw data into actionable information for businesses using measures such as sorting, cleaning, and analysis. The technique entails the following steps:

-
Setting an Objective
Defining your aim entails developing a theory and determining how to evaluate it. It may appear to be a simple task, but it might be more difficult. For instance, the company’s top management may address questions like, “Possible expansions in a company” or “Why is the sales dropping?”
-
Gathering Information
Data collection methods can vary considerably between businesses. Businesses can now collect unstructured data from numerous channels, such as point-of-sale terminals (POS), social media, online surveys, customers’ purchase patterns, comments, cloud apps, mobile applications, mobile phone records, emails, etc.
The first stage is to collect all the data from any source and place it in data warehouses in its raw form. Salesforce DMP, SAS, and the data integration platform Xplenty are some well-known business data sources to acquire data from. One may also experiment with open-source systems such as Pimcore.
-
Sorting of Data
Data professionals then step in to divide the data and set it up for analytical queries following the data’s acquisition and storage. There are two main schools of thought when it comes to data processing, and they are as follows:
- During batch processing, large data sets are handled in chunks and processed at different times. The batch processing method is helpful to businesses when there is enough time between data collection and analysis.
- Steam processing, which analyses a small data batch all at once, shortens the time it takes from when the data is collected until it is analyzed. As an alternative to the cheaper but slower batch process, management often uses the Steam method when instantaneous decisions are required.
-
Cleaning the information
There is no such thing as a little data load, and data scrubbing and filtering are always necessary. It’s important to double-check and either delete or properly account for any information that doesn’t belong. Why? Since erroneous or misleading data may severely impact analysis results. It includes:
- Getting rid of big mistakes, duplication, and outliers
- Removing unnecessary data points
- Giving your data structure
- Bridging major gaps
OpenRefine tool is great for both simple data cleaning and high-level investigation.
-
Analyzing the Data
It will take time to transform massive amounts of data into a usable format. Once completed, advanced analytics can transform massive datasets into useful and actionable insights.
Data mining is one of the most popular techniques for analyzing large amounts of data. By classifying massive datasets, it can find abnormalities and produce data clusters that can be used to discover connections and patterns.
One of the most helpful tools for business owners, researchers, and regular people is data mining, which allows them to glean insights from massive data stores. Knowledge Discovery in a Database is another name for data mining (KDD). The knowledge discovery process includes below parts:
- Data cleansing
- Data integration
- Data selection
- Data transformation
- Data mining
- pattern evaluation
- knowledge presentation
All types of data analysis fall under one of the four categories of analysis listed below:
- Descriptive analysis – determines what has previously occurred.
- Diagnostic analysis – concentrates on figuring out why something occured
- Predictive analysis – uses previous data to identify future patterns.
- Prescriptive analysis – helps you to create future suggestions.
-
Result Sharing
Sharing these insights is the final stage in the data analytics process. This is more complicated than simply sharing the raw findings of your work; it entails analyzing the data and presenting them in a way that various sorts of audiences can understand.
How you evaluate and display findings may often impact a company’s direction. Your firm may decide to restructure, introduce a high-risk product, or even shut an entire division based on what you give.
Because you’ll be presenting information to decision-makers regularly, the insights you give must be completely obvious and unambiguous. For this reason, data analysts typically employ reporting, graphs, and informational visualizations to support their results. Google Charts, Tableau, Datawrapper, and Infogram are all popular tools.
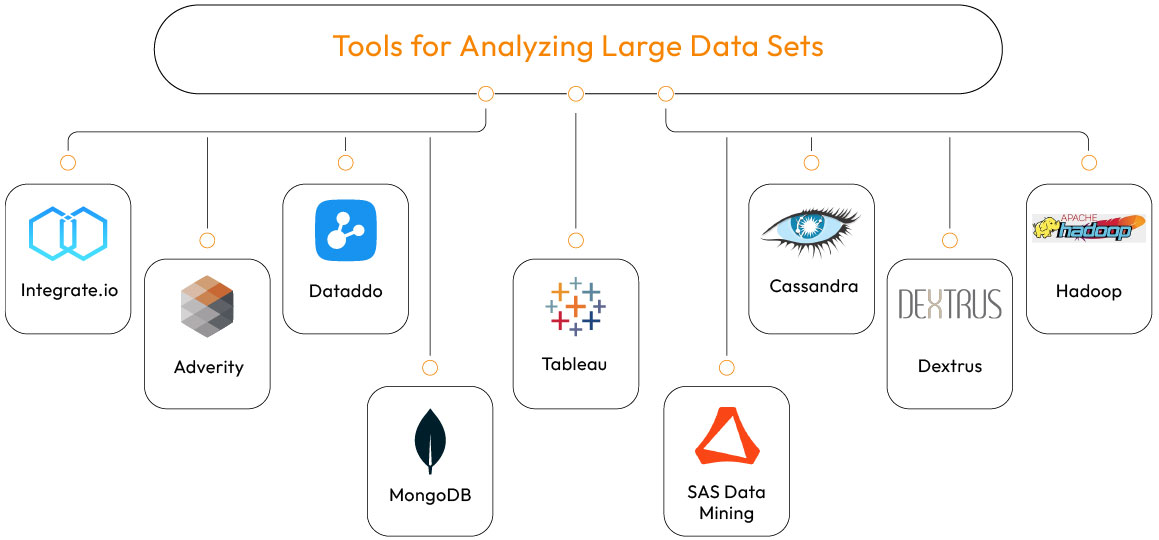
Tools for Analyzing Large Data Sets
The term “big data analytics” has become so popular that almost every major technology corporation offers a product with the label, and many startups provide similar solutions.
Particularly trendy at the moment are cloud-based methods for analyzing large amounts of data. In fact, according to the results of AtScale’s 2016 Big Data Maturity Survey, 53% of respondents currently want to adopt cloud-based big data solutions, and 72% intend to do so in the future.
Hadoop and other open source tools are crucial since they are the backbone of many commercial solutions.
Data-driven decisions require the results from big data analytics, which in turn depends on a wide range of software tools, including complex underlying technologies. Some of the most important tools in this field are:
-
Integrate.io
Integrate.io is a cloud-based service that can be used to gather all of your data sources into one place, analyze them, and get them ready for analytics.
The data you collect from various sources will be consolidated. Its graphical user interface makes it easy to implement ETL, ELT, or a replication solution.
Integrate.io is a comprehensive set of low-code and no-code tools for constructing data pipelines. Marketing, sales, support, and even programmers can all find what they need there.
When you use Integrate.io, you can maximize your data’s potential without spending a dime on extra gear, software, or staff. Integrate.io offers customer service by email, chat, phone, and video conferences.
-
Adverity
Adverity is an adaptable end-to-end marketing analytics platform that provides real-time insights and consolidated views of marketing performance for business leaders.
Adverity allows marketers to monitor marketing success in a unified view and effortlessly unearth fresh insights in real time by utilizing automated data integration from over 600 sources, robust data visualizations, and AI-powered predictive analytics. This outcome is increased growth, profitability, and a quantifiable return on investment.
-
Dataddo
Dataddo a cloud-based, no-code ETL platform that prioritizes customization, allowing users to pick their metrics and attributes and connect to various data sources.
Data can easily integrate with your current data stack without structural changes or adjustments to your current procedures. Instead of spending time learning how to use yet another platform, you can get right to work integrating your data thanks to Dataddo’s straightforward UI and speedy setup.
-
MongoDB
Developed in C, C++, and JavaScript, MongoDB is a NoSQL document-oriented database. It’s open source, free to use, and compatible with Windows Vista and, later, OS X 10.7, Linux, Solaris, and FreeBSD.
Aggregation, ad hoc searches, support for the BSON format, sharding, indexing, replication, server-side javascript execution, schema-less collections, capped collections, load balancing, and file storage are just some of its many capabilities. Facebook, eBay, MetLife, Google, etc., are just a few large companies that use MongoDB.
-
Tableau
Tableau is a business intelligence and analytics software solution that provides a suite of interconnected tools for making sense of information for some of the top companies in the world.
Tableau Online, Tableau Server, and Tableau Desktop are the three primary components of the software (to the cloud). Tableau Reader and Tableau Public have also introduced two additional products.
Tableau provides real-time, personalized dashboards and can handle data of any size, making it accessible to technical and non-technical users. It’s a fantastic resource for examining and visualizing data.
Verizon Communications, ZS Associates, and Grant Thornton are just a handful of well-known companies that use Tableau.
The looker is the most comparable alternative to Tableau.
-
SAS Data Mining
SAS Visual Analytics simplifies the analysis and dissemination of the decisive insights into data that businesses require. If you need a simple interface and are willing to spend a little extra for it, this is one of your better options.
This program is excellent for making charts and other visual representations of your data. These programs can also be used for data mining and statistical modeling.
Businesses can use them to display their studies in meetings and aid in making connections between different parts of the business. Furthermore, this enables data analysis. Risk and reward can be estimated for various marketing campaigns using predictive models.
-
Cassandra
In addition to Python, Apache provides Cassandra’s free database management system. The built-in NoSQL DBMS allows open-source software to handle enormous data volumes. Even data splintered among multiple commodity servers is no problem for it to handle. CQL (Cassandra Query Language) is its database query language.
Because of its performance, Cassandra has been adopted by several well-known businesses. Users include Facebook, American Express, Accenture, Yahoo, GE, and Honeywell. Its simple ring architecture, automated replication, and easy log-structured storage are just a few of its advantages.
Although troubleshooting and maintenance can be a bit more labor intensive than other solutions, the free pricing makes it worth it. Throw that it responds quickly and doesn’t tax your system too much; you’ve got a real winner.
-
Dextrus
Dextrus supports automated data acquisition, streaming, transformations, cleansing, preparation, wrangling, reporting, and machine learning modeling. Some of the features are:
Pros: One of the components, “DB Explorer,” aids in querying the data points to gain immediate insight into the data via the capabilities of the Spark SQL engine.
Query-based change data capture is one approach to discovering and feeding changed data from source databases into downstream staging and integration layers.
Reading the database logs to find the continuous changes happening to the source data is another technique for real-time data streaming.
As the first step in anomaly detection, data pre-processing or purification is generally performed to offer a high-quality dataset for the learning algorithm to work with.
-
Hadoop
Hadoop’s open-source framework is advantageous because it does not cost anything and uses inexpensive technology for storing and processing massive amounts of data and executing concurrent programs on clusters of commodity hardware.
It has emerged as a crucial technology for conducting business.
Uses of big data in several fields
Data analysis is used by many of today’s leading companies to make more educated decisions about product strategy, operations, sales, marketing, and customer service.
It’s all about product growth. By sifting through massive amounts of business analytics data, big data analytics helps organizations learn about their consumers’ needs, guides the product development process, and lays out a plan for the future.
Streaming services and online retailers assess user participation to provide a more customized purchase and viewing experience. Suggestions, targeted ads, upsells, and loyalty programs all play a role in achieving this goal.
With big data analytics, any business that handles massive volumes of information may extract useful knowledge from that data. Every business has access to this capability. Only a handful of the numerous conceivable real-world uses are included below:

Supply Chain Management
Supply chain management entails establishing order and exerting authority over the flow of goods.
Predictive analytics can describe and predict all aspects of the supply chain, including inventory, procurement, delivery, and returns.
Businesses can save money and boost productivity thanks to the analysis of financial data, which helps them identify and eliminate unnecessary operating expenditures.
By analyzing customer order histories, search data, online reviews, and other data sources, online merchants may predict their customers’ behaviors, which helps in two ways:
- Acquiring new customers and retaining existing ones
- Growing the business. The data from this analysis can be incorporated into strategies for retaining more of your current clientele.
Academic Sector
There is a deluge of information in the education sector, including data on students, teachers, classes, grades, and other outcomes.
When studied and analyzed carefully, it is clear that this information can yield useful insights that can be used to enhance the efficiency and effectiveness of educational institutions.
Several areas of the education sector have seen a significant transformation as a result of the advent of big data applications, including:
- Learning Programs that are Individualized and Evolving
- Subverting Lecture Notes
- Methods of Evaluation
- The Future of Your Profession
- Use of Large Amounts of Data in the Academic Sector as an Illustration
The lack of effective solutions to analyze such large amounts of data in the past made some of the data seem pointless.
Health-Related Sector
Adding healthcare to the list of sectors that are sure to produce copious amounts of data is inevitable. Some of the benefits of big data in medicine are as follows:
- Eliminating the need to conduct redundant diagnoses is one way big data can cut down on treatment expenses.
- It’s useful for forecasting the spread of infectious diseases and figuring out how best to head them off before they cause widespread destruction.
- Preventable diseases can be avoided with this method of early detection. As a result, they don’t progress to a point where treatment is difficult or ineffective.
Medicine that has been identified and given to patients based on a study into their outcomes in the past is called “evidence-based medicine.”
To Improve Health Care
The healthcare sector recently introduced wearable devices and sensors that can transmit real-time information into a patient’s electronic health record. Apple is one example of this kind of technological advancement.
Apple HealthKit, CareKit, and ResearchKit have been developed. The primary objective is to give iPhone owners the ability to keep and access their up-to-date medical records wherever they happen.
In Government Organisations
Daily, governments of all shapes and sizes must deal with a deluge of information. This is because governments have abundant records and databases to keep tabs on, including information about their citizens, economic development, energy resources, geographical surveys, and more.
That’s a lot of information that goes into big data. The U.S. Federal Government’s Food and Drug Administration (FDA) uses big data analysis to find patterns and relationships, enabling it to detect and investigate the occurrence of predicted and unforeseen food-borne illnesses.
Thus, there are countless ways in which governments might benefit from the careful study and analysis of such data. Here are just a few examples:
- In the context of welfare schemes, this entails the ability to make quicker and better decisions about a range of political programs.
- To triumph over problems confronting the nation, such as high unemployment, terrorism, and the exploration of energy resources.
- In cyber security, big data analytics has found extensive applications in detecting fraud.
- Engineers specializing in cyber security prevent hackers from gaining access to systems and information.
Entertainment Sector
The widespread availability of digital tools has resulted in a dramatic increase in data production, largely responsible for the recent boom of big data in the entertainment and media sectors.
This isn’t the only source of new information, though; social media sites are a major driver, too.
Media and entertainment companies may have been slow to grasp the value of this information, but they have been among the first to use it to their advantage.
Below are just a few examples of how the media and entertainment industry can reap the rewards of big data:
- Audience interest forecasting
- Scheduling media streams in digital media distribution systems to perform best or on demand
- Learning from previous buyers’ experiences
- Ads that hit their intended audiences
Spotify, an on-demand music platform, uses Big Data Analytics to compile information about its users worldwide and recommend songs based on that information.
In Meteorology Department
Satellites and weather sensors can be found in every corner of the Earth. They provide a wealth of information to track weather and environmental trends.
Big data includes the information gathered from these sensors and satellites, which may be put to various uses.
- Foreseeing the weather is an important part of the field of hydromet
- Examining Climate Change
- The study of natural disaster trends
- To get things ready for a crisis
This study aims to foretell the global availability of potable water.
In Transportation Sector
Transportation has been simplified and improved thanks to the advent of big data in many forms. Some of how big data aids the transportation sector are described here.
Users’ needs on various routes and with various means of transportation can be estimated with big data, allowing route planning to cut down on waiting times.
The use of big data has allowed for the real-time estimation of congestion and traffic patterns, which has significant implications for traffic management and control. For instance, many individuals are turning to Google Maps to find the least congested routes.
The traffic volume: Using real-time processing of big data and predictive analysis to identify accident-prone locations can reduce accidents and raise the safety level of traffic.
Financial Institutions or Banking Sectors
There is a meteoric rise in the volume of data generated in the financial sector. The GDC forecast predicts a 700% increase in this data by next year’s end. Data collection and analysis can aid in the detection of criminal acts like:
- Use of Debit and Credit Cards Impermissibly
- Evaluation of the Risks Associated with Business Investment Credits
- Clarity in Business
- Changes in customer data
- Abatement of Dangers
Data Analytics in Banking is used by many anti-money laundering programs like SAS AML to monitor for suspicious activities and examine customer information. For almost 25 years, Bank of America has relied on SAS AML.
Marketing or Retail
Customer surveys and face-to-face contact were the backbones of conventional marketing strategies. Many businesses use outdoor billboards, radio spots, and television commercials to promote their products and services. They had no clue how effective their advertising was until it was too late.
This marketing branch went digital along with the rise of the internet and technologies like big data. With the advent of big data, it is now possible to quickly and easily gather vast amounts of information about many consumers’ preferences.
Marketers rely on Business Analysts to sift through data and draw conclusions that will aid in the execution of campaigns, the optimization of CTRs and ad placement, the enhancement of products, and the protection of subtleties. Insights from Big Data in Business.
The generation of business insights is one of the most promising uses of Big Data in today’s businesses. Sixty percent or more of the data acquired by businesses and social media sites are either unstructured or were not evaluated.
Many issues that affect profits, consumer satisfaction, and new product development may be resolved with the proper application of this data.
Fortunately, businesses are starting to see the value of employing cutting-edge tools to manage and analyze this data better.
Netflix is one of the businesses that is making use of Big Data to learn about its customers, the kinds of content they prefer, the most popular movies on the site, the kinds of related content it may propose to the user, and the kinds of series and movies it should produce.
Space Industry
Space organizations gather vast volumes of information daily by observing space and receiving data from earth-orbiting satellites, space probes, and planetary rovers.
To mimic the flight path of the actual payload before launching it into space, they analyze petabytes of data. Complex simulations must be done and many aspects considered, including weather, cargo, orbit location, trajectory, etc., before a rocket can be launched.
To prepare for their planned expedition to Mars, NASA, for instance, uses a variety of satellites and rovers to gather information about the planet’s topography, weather, and other elements. The massive amounts of data generated are managed and analyzed with the help of big data, which is then used to power simulations.
The value of analytics on big data
Here are some of the advantages of utilizing big data analytics:
- Analyzing massive datasets in a short time, despite a wide variety of data kinds and sources.
- Decisions may be made more quickly and with greater accuracy, leading to more effective strategic planning and, ultimately, better outcomes in supply chain management, operations, and more.
- Money is saved from better management and execution of business processes. The expenses of IT infrastructure were dramatically decreased by using certain technologies, such as Hadoop and cloud-based analytics. These technologies make storing larger amounts of organized and unstructured data easier and less expensive than traditional methods.
- Greater Efficiency: Hadoop is significantly more efficient since it teaches companies how to use data fast and offers analytical insight. This is far quicker than the older, more traditional ETL (Extract, Transform, and Load) technologies, which required time to load data from the source to the destination BI system since they were laborious and time-consuming. These contemporary business analytics technologies improve a company’s productivity and aid its ability to make decisions swiftly.
- Possibility of gaining marketing insights and data for product creation based on a deeper familiarity with customers’ wants, needs, and feelings.
- Big data sets can be used to inform better risk management techniques.
- Big data analytics also helps businesses to develop new goods and services for their customers. At the same time, e-commerce businesses utilize analytics to build new products and corporations. GE is investing in new service models for their industrial goods utilizing big data analytics.
- Big data may enable businesses to respond more quickly, allowing them to adapt to developments faster than their rivals.
- Web-based businesses are creating digital products that integrate client data to provide more enticing suggestions and profitable discount programs.
- Big Data can detect and prevent fraudulent transactions, like in the case of financial services. Fraudsters are becoming more sophisticated, and individuals must be aware that they should not divulge private information; automated software may detect fake accounts and cards. It’d also be feasible to manually track what is generally overlooked based on repeating trends and customer purchasing patterns.
Analytics of Big Data Pose Difficulties
It’s unrealistic for businesses to assume that establishing a solution for big data analytics will be a breeze. While many firms are employing big data analytics, the percentage of those reporting a financial benefit from doing so is far smaller.
The benefits promised by big data analytics providers may be difficult to realize due to several different problems, such as the following:
Big data analytics faces several severe challenges, one of the most significant of which is the exponential growth of data.
IDC reports that the amount of data stored on servers worldwide doubles every two years. Imagine a stack of iPads stretching 6.6 times the distance between Earth and the Moon to give you an idea of how much data that is. Businesses require analytics solutions for big data that can grow with their needs without sacrificing performance or reliability.
Unstructured Data
A business’s vast majority of data does not reside in structured databases. Unstructured data includes electronic mail, images, reports, audio files, video files, and other file types. Searching through this type of unstructured data can be extremely difficult without advanced artificial intelligence capabilities.
Manufacturers of big data analytics tools regularly release upgrades designed to make the software more effective at analyzing and gaining insights from unstructured data.
Enterprise resource planning (ERP) systems, customer relationship management (CRM) solutions, supply chain management software, e-commerce solutions, office productivity programs, and many others can generate data for an organization.
Still, often this information is kept in silos. Integrating data from many sources is likely a major challenge for any big data analytics project.
Cultural Barriers
Although big data analytics are on the rise, they have not yet fully entered the culture of all businesses. A poll by NewVantage Partners found that 52.5% of CEOs and C-suite executives say that internal organizational hurdles, including a lack of alignment, internal resistance, or a lack of resources, are the biggest barrier to achieving their organization’s goals.
Conclusion
We have entered a unique era in the development of data analysis, made possible by the advent of Big Data, low-cost commodity technology, and innovative information management and analytical tools. The coming together of these tendencies means that, for the first time, we have the tools to examine truly staggering data volumes in a timely and cost-effective manner.
The skills in question are not academic or unimportant. They represent a significant advancement and a promising chance to reap substantial gains in effectiveness, productivity, output, and earnings. They also offer a great chance to make significant progress in the following areas:
If business and technology experts can keep working together and making good on their promises, we may live in truly revolutionary times: the era of big data. So long as they can deliver on the promise made by the data, I could care less about the promise itself.